
Analytical Applications, Models, and Themes
Actionable Intelligence in Market Management
Innomis Market Management Intelligence® Solutions transform data into Effective Information and Actionable Intelligence via Analytical Applications together with Analytical Models and Themes.
Analytical Applications enable fast insights and multiple ways for information access and use. Analytical Models and Themes – applied in applications – deliver structured, model-driven information for deep and comprehensive insights in complex matters.
Analytical Applications
Analytical Applications for Fast Insights in Management Processes
Analytical Applications provide many ways to access, transform, visualize, and analyze data. This empowers users to utilize data fast and effectively, delivering Actionable Intelligence for all user groups and business processes in market management.
Analytical Applications:
- Innomis Analyzer
- Innomis Dashboard
- Innomis Reporter
- Innomis Embed
- Innomis Data/API

Analyzer Applications
For Deep Insights
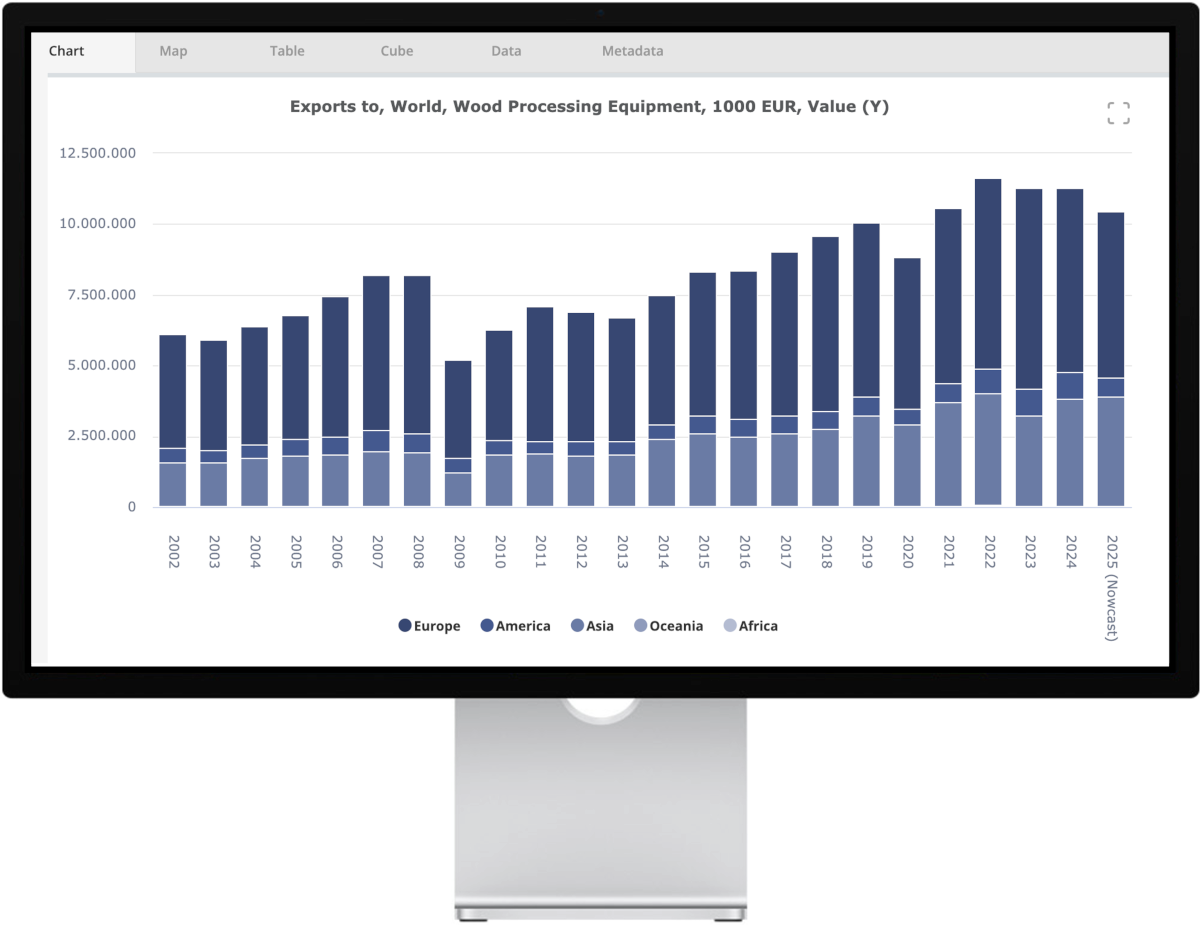
Innomis Analyzer Applications enable rapid, in-depth data exploration and mining through dynamic navigation and advanced analytical functions. Users benefit from flexible, multi-dimensional analysis and multiple output formats for both raw data and visualization.
Analyzer Applications are available in two versions for yearly and monthly data:
- Yearly Analyzer Applications – deliver analyses for long-term insights through yearly time series.
- Monthly Analyzer Applications – deliver analyses for short-term insights through monthly time series.
Dashboard Applications
For Comprehensive Visualization
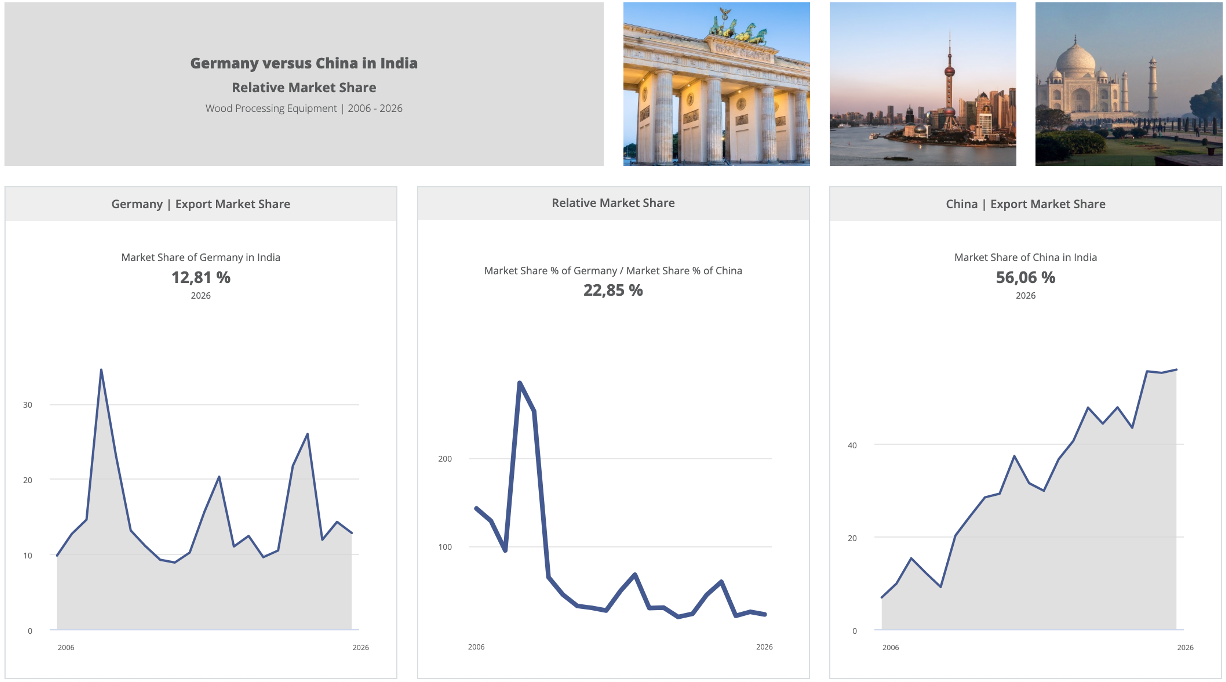
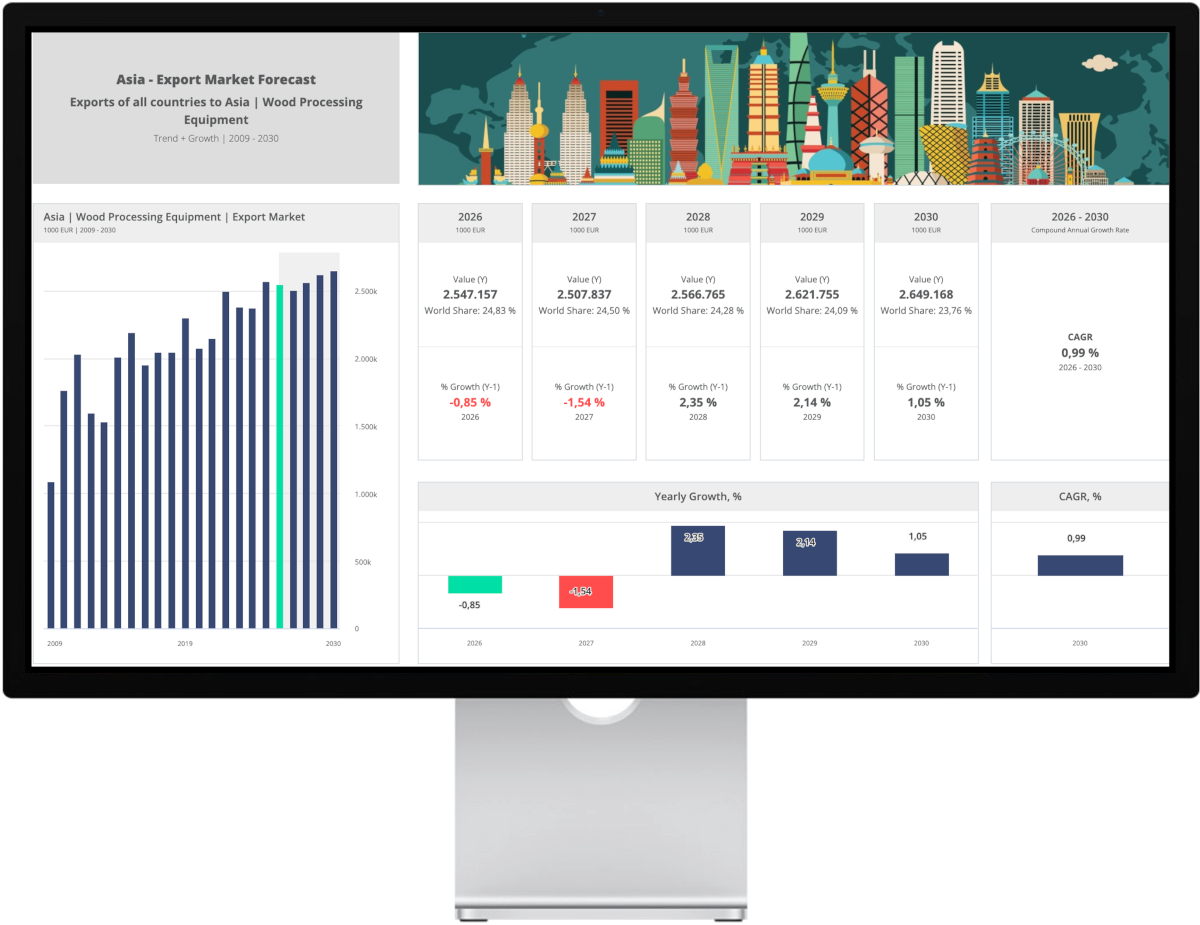
Innomis Dashboard Applications deliver ready-to-use visual analytical information. They are based on a comprehensive analytical information model and offer a large set of pre-built and data-specific analytical themes.
Dashboard Applications enable fast, structured insights into all aspects of market management and are available in two design models:
- Single Domain Dashboards – for deep insights into one specific information domain.
- Multi Domain Dashboards – for unified insights into complex issues across multiple domains.
Reporter Applications
For Automated Reporting
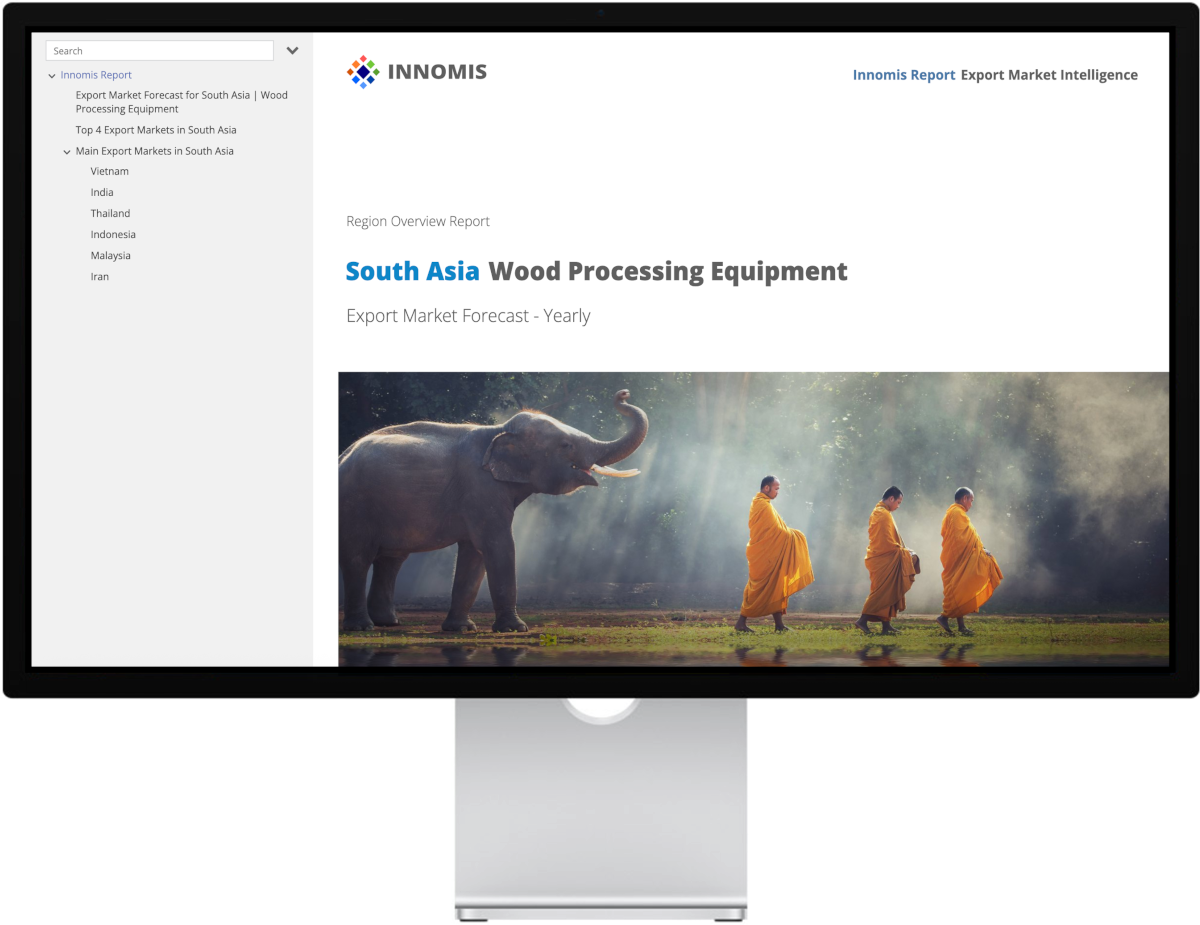
Innomis Reporter Applications provide analytical stories through dynamic and automated reporting processes, delivering up-to-date information in both comprehensive overviews and detailed analyses.
Innomis Reports cover both single and multiple information domains, ensuring comprehensive decision support with:
- Theme Reports – for insights on one specific information domain.
- 360° Reports – for unified insights across multiple information domains.
Embed Applications
For Smart Access
Innomis Embed Applications integrate data and analytics from a single source – the Innomis platform – into additional information applications and objects. They make data and information more flexible and valuable by seamlessly incorporating them into various settings and workflows.
Two examples of embedding are:
- Specific Views – focused on a selected part of a larger information domain, defined for specific users or processes.
- Process Integration – integrating data and analytical views from one application into one or multiple other applications.

Data/API Applications
For Data Anywhere
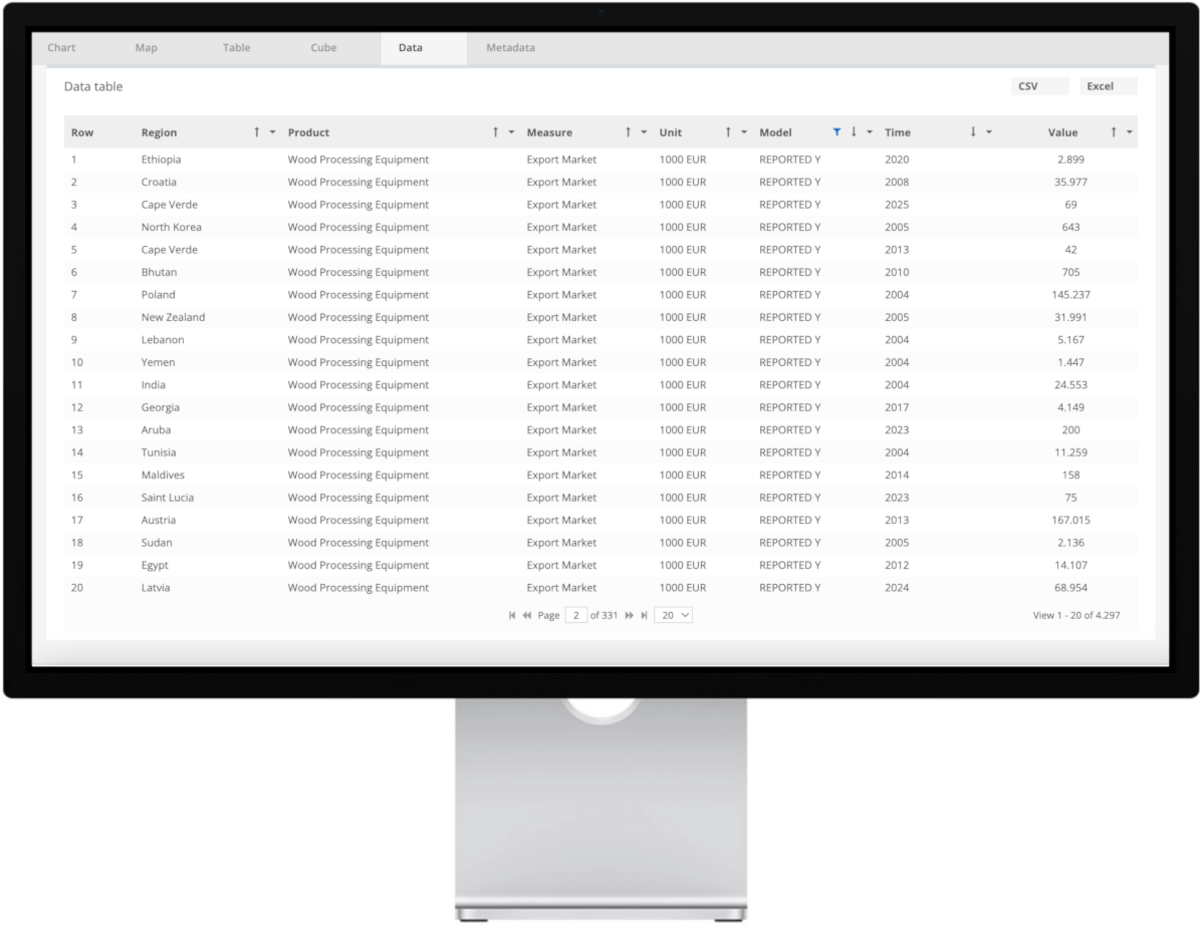
Innomis Data/API Applications provide access to highly integrated, structured analytical datasets. They support information managers and analytical experts in accessing, browsing, viewing, and exporting datasets at the lowest aggregation level.
Two versions are available:
- Basic Data Grid Application – a focused version for tabular data access and download.
- Advanced Data API Application – an enhanced version with advanced API functions for specialists.
Analytical Models and Themes
Structured and Visualized Information Models
Analytical Models and Themes are designed to address key insight issues for informed market management decisions.
Each theme comprises a conceptual micro-model that guides the transformation of raw data into Effective Information and Actionable Intelligence through analytical applications, empowering better decision-making anytime and anywhere. All themes are integrated elements of the Innomis Market Management Intelligence model.
Explore the analytical model and theme types below:
- Overviews
- Trends
- Structures
- Dynamics
- Relations

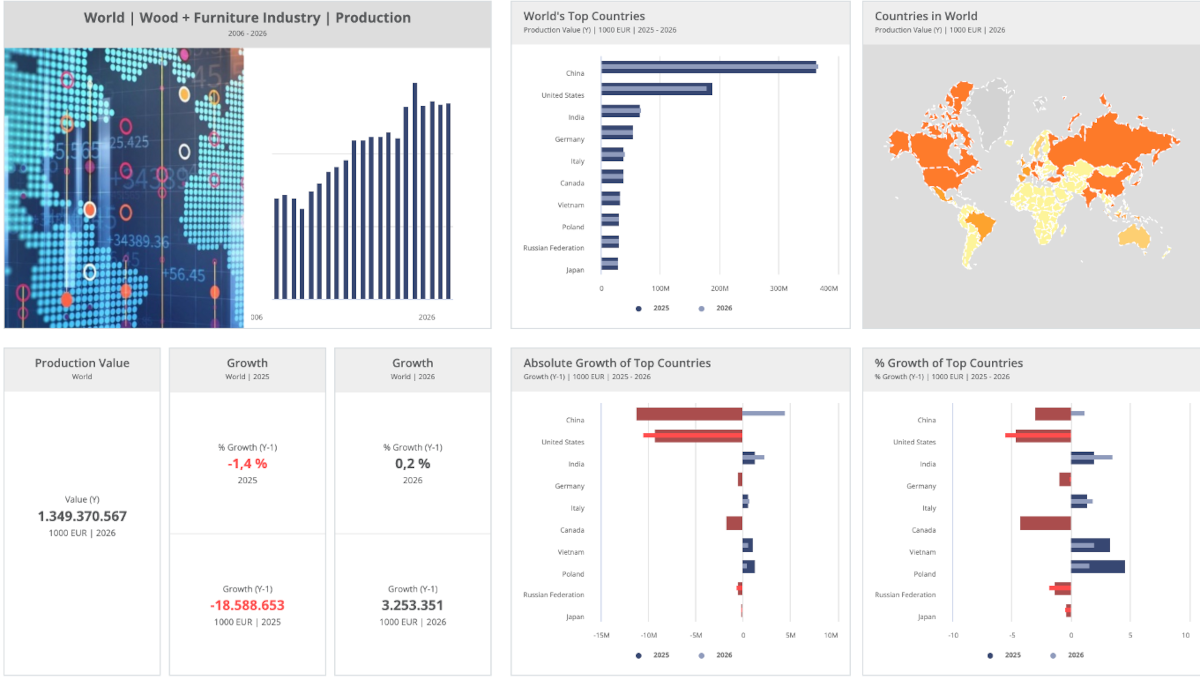
Overviews
Models and Themes For Rapid Insights into Complex Patterns
Overview models and themes integrate multiple analysis types into a single view, using hybrid visualization techniques.
By combining trend visualizations, structural breakdowns, and dynamic relations, they provide comprehensive insights into complex patterns.
Users can monitor several key metrics simultaneously and gain complete situational awareness through dashboard and reporter applications.
Trends
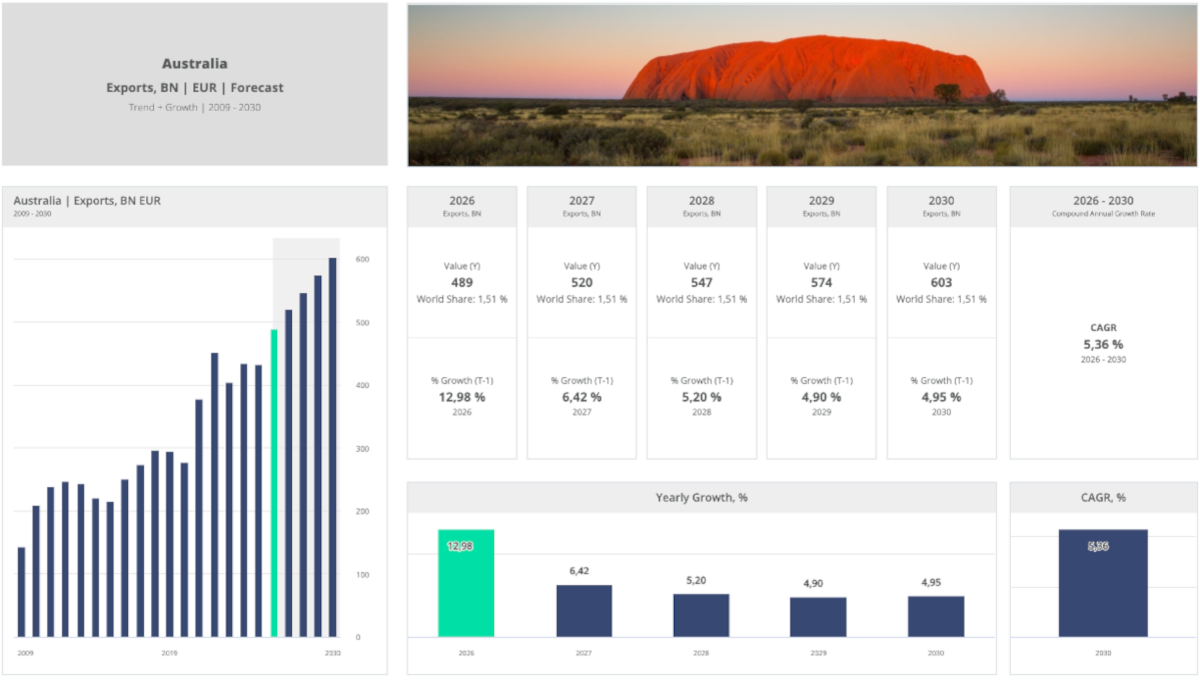
Models and Themes to Analyze Trends
Trend models and themes track changes over time using time series analysis and visualization techniques.
By analyzing growth patterns, short- and long-term dynamics, and periodic variations, they reveal both strategic opportunities and short-term market momentum.
Users can quickly identify upward and downward trends, cyclical patterns, and directional changes to assess market direction and optimize strategic timing through analyzer, dashboard, and reporter applications.
Structures
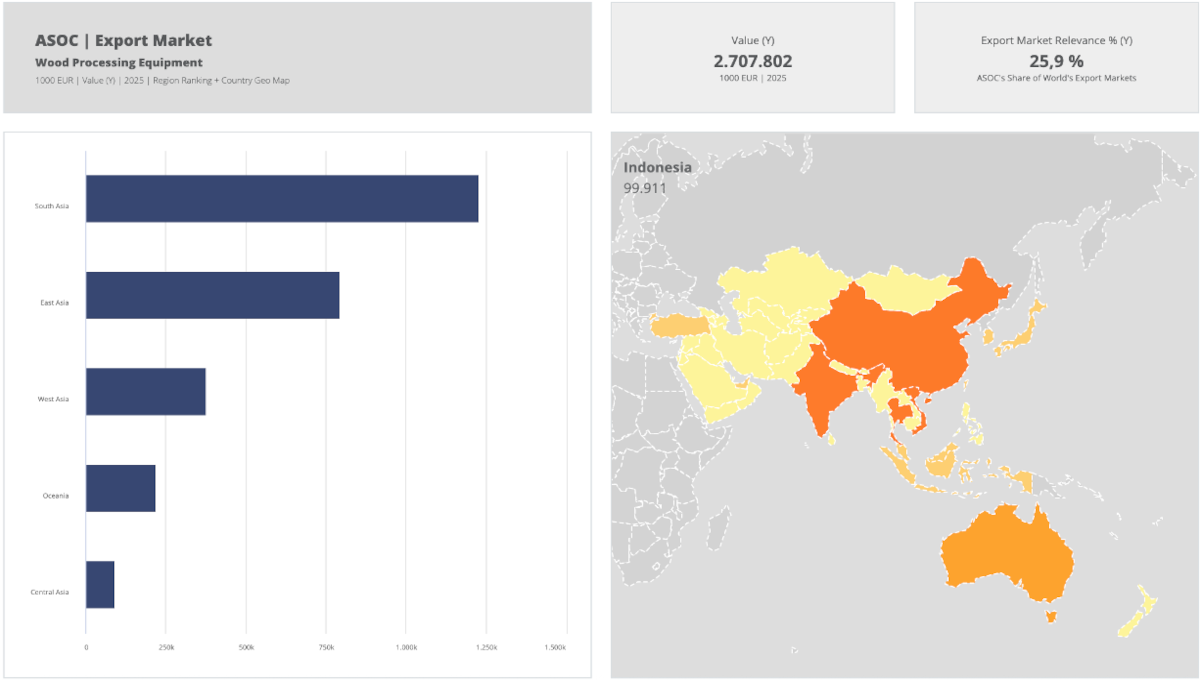
Models and Themes to Understand Structures
Structure models and themes analyze market, value chain, and indicator compositions at specific time periods using cross-sectional data visualization techniques.
By breaking down totals across regions, industries, products, and indicators, they reveal market structures and strategic positions within categorical breakdowns.
Users can instantly identify leaders, assess the competitive landscape, and evaluate portfolio positioning to guide strategic priority decisions through analyzer, dashboard, and reporter applications.
Dynamics
Models and Themes to Identify Shifting Patterns
Dynamics models and themes combine structural and temporal analysis to show how market composition changes across regions, industries, products, competitors, and key indicators.
Tracking simultaneous shifts across those dimensions reveals emerging patterns and strategic transitions throughout markets and management domains.
Users can monitor dynamics worldwide, anticipate inflection points, and capitalize on evolving opportunities to guide proactive strategic planning through analyzer, dashboard, and reporter applications.
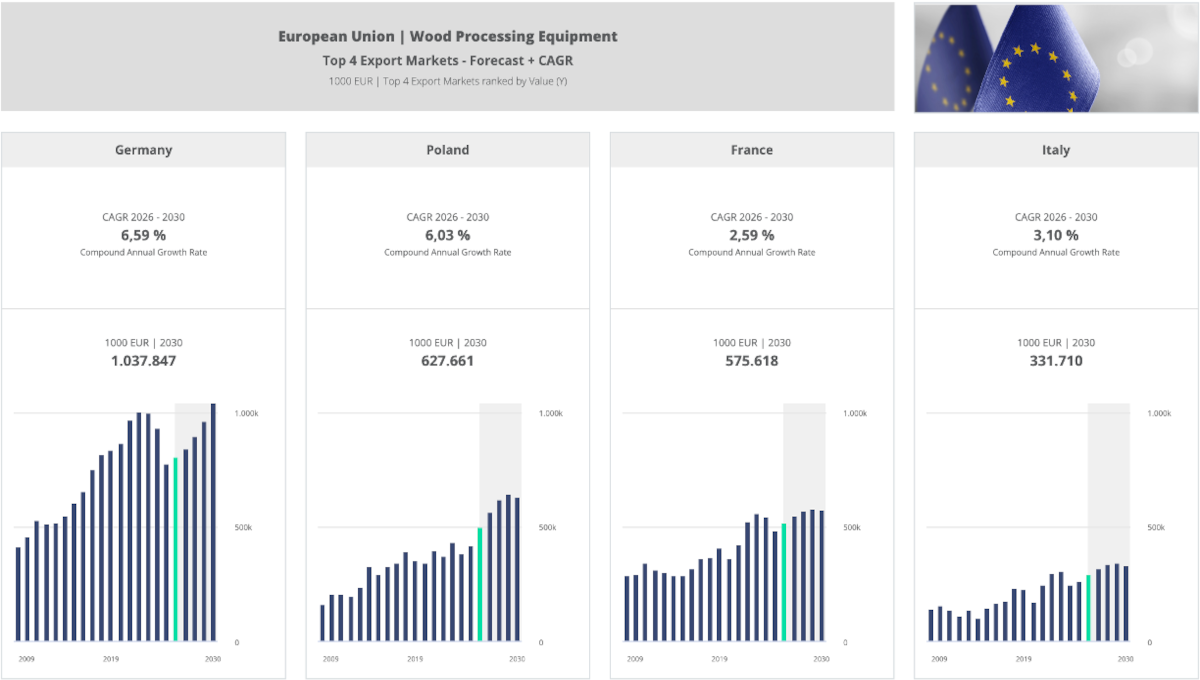
Relations
Models and Themes to Analyze RELATIONS and Dependencies
Relations models and themes analyze and visualize relations and dependencies across market, performance, and management dimensions.
Mapping these relationships using multivariate visualization techniques with Innomis Analyzer and Dashboard applications reveals connections and influence patterns.
Users can identify key influence factors and understand variable interdependencies to optimize strategic and operational activities.